Product Mix
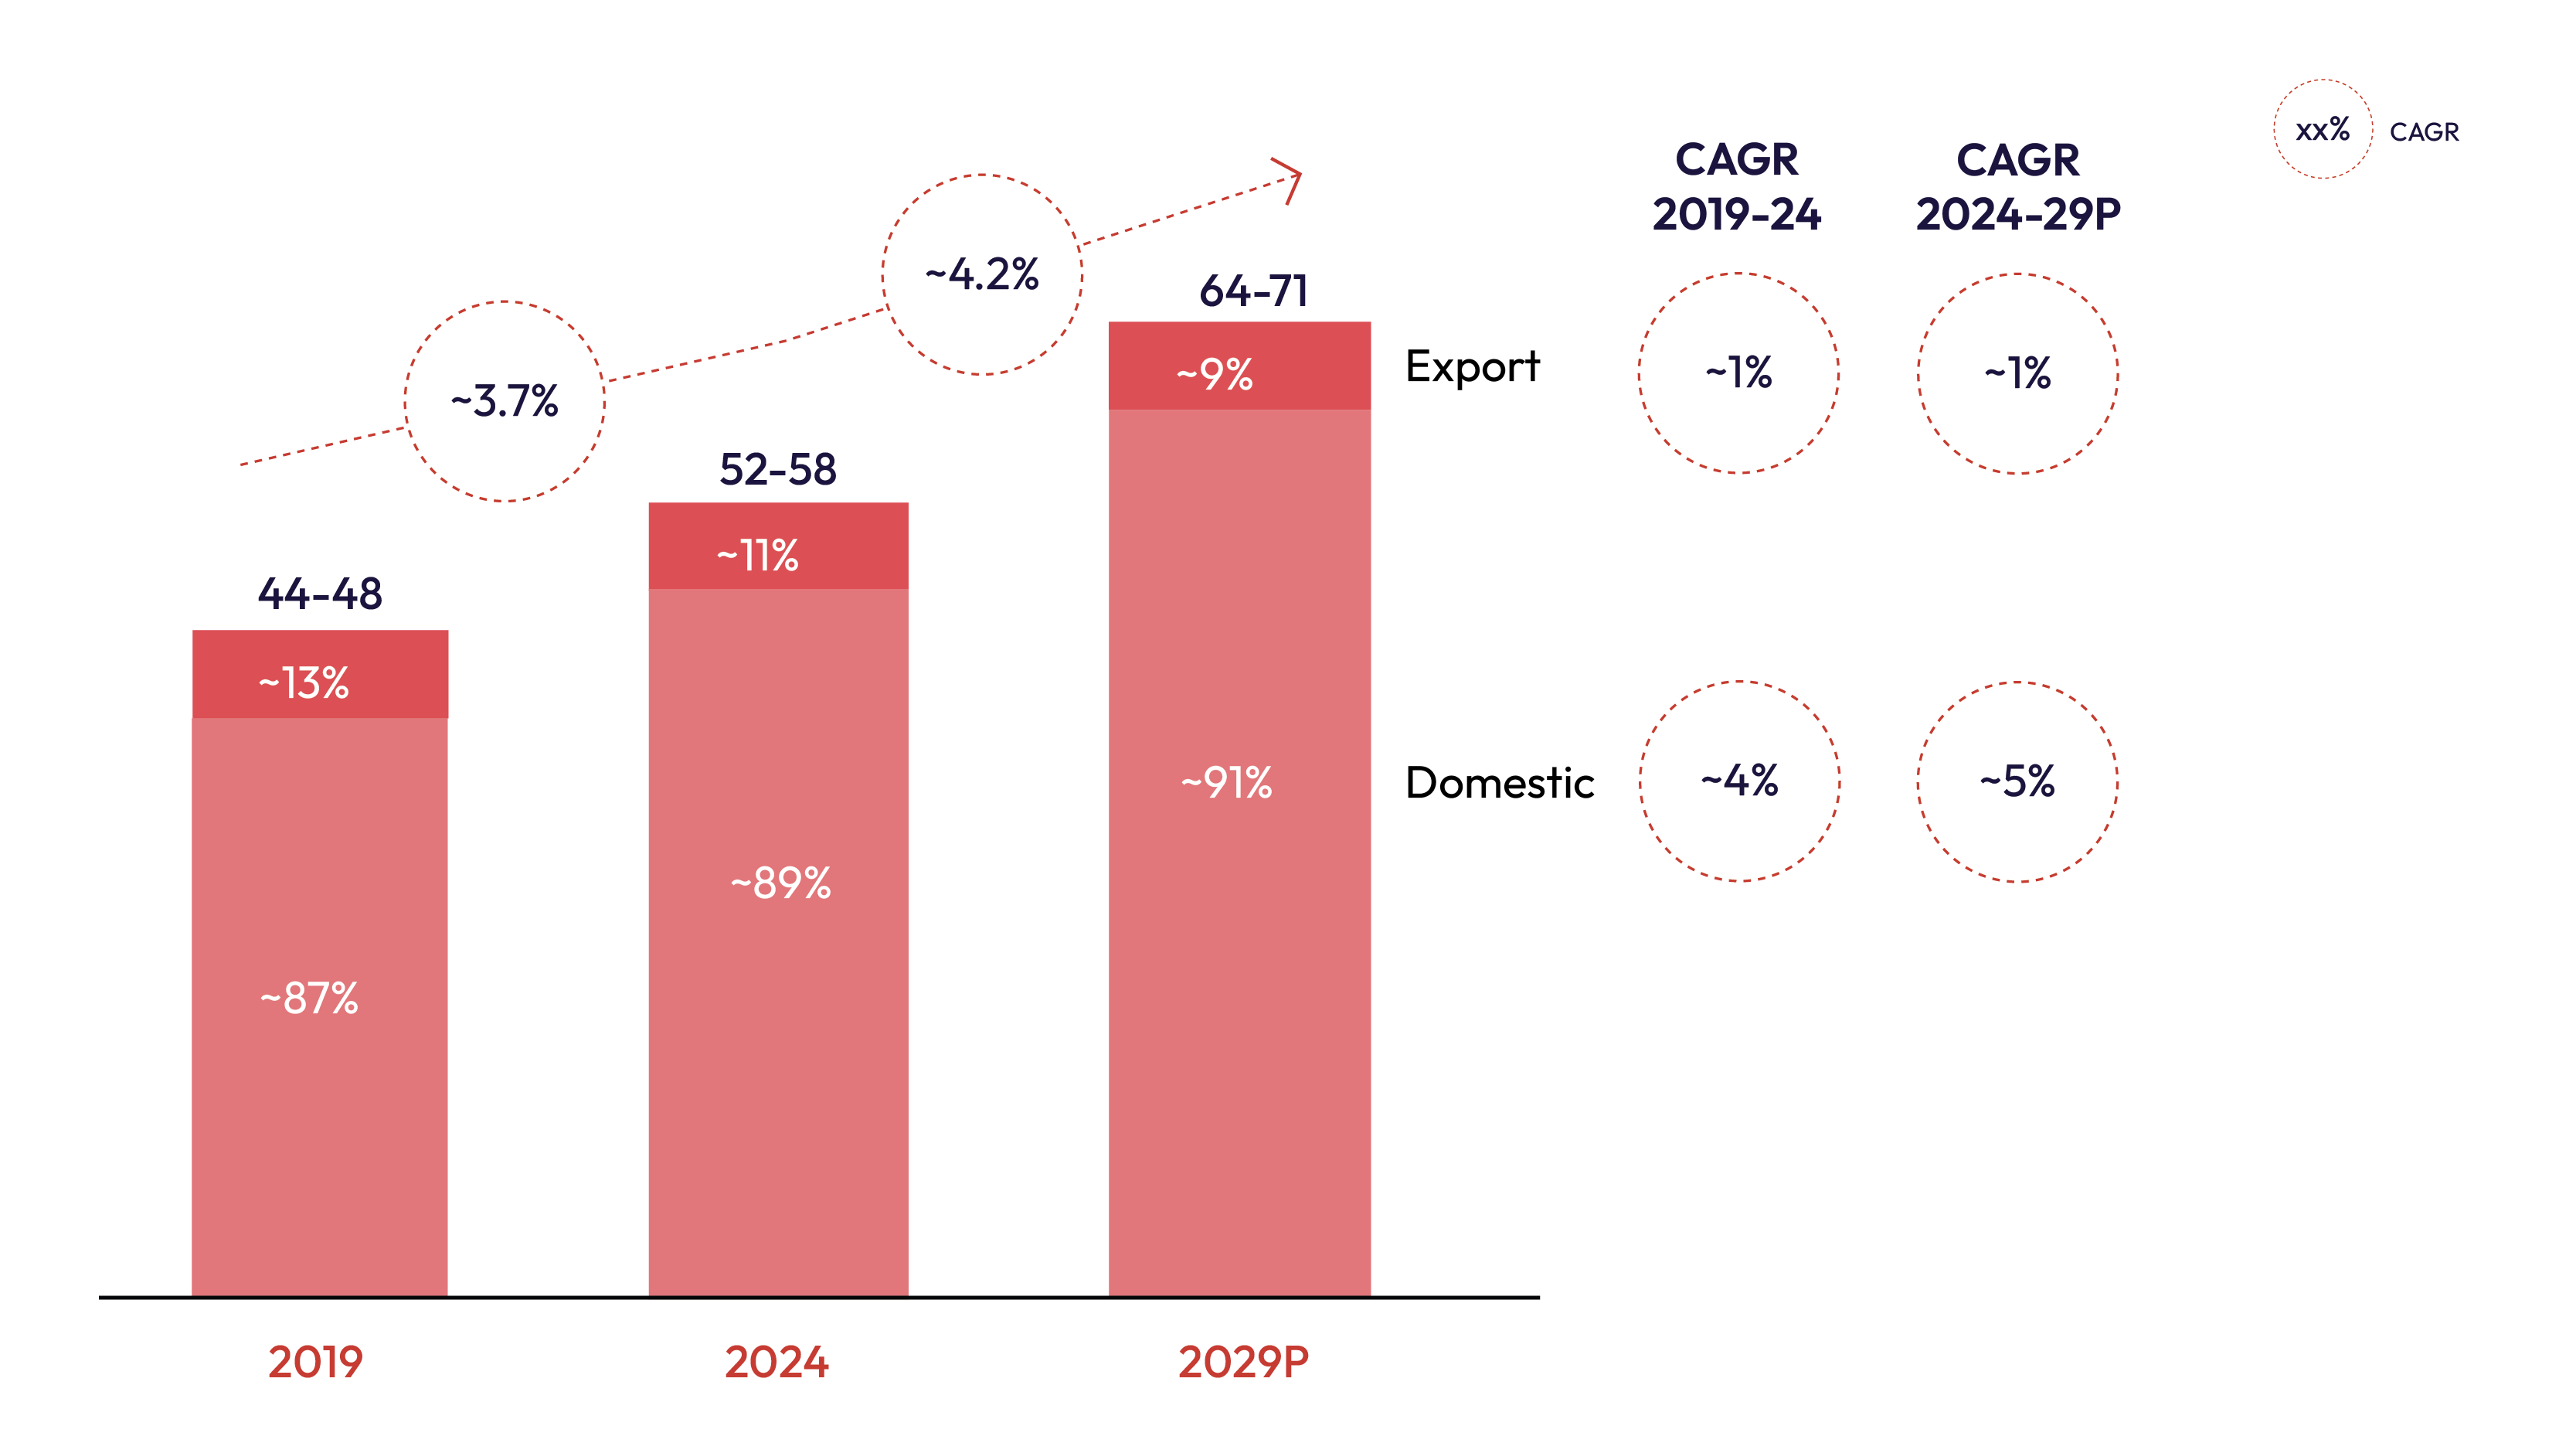
In CY 2024, the US seafood market was characterized by a predominant share of live, fresh, or chilled products, which comprised ~75% of the effective consumption, reflecting a clear consumer preference for premium and minimally processed seafood. Frozen products accounted for another ~16%, supporting the need for extended shelf-life and logistical efficiency. Meanwhile, dried, smoked, or salted items and other preserved or processed preparations represented ~3% and 6% of effective consumption, respectively, indicating a smaller but notable segment for alternative processing methods. These trends show an evolution from CY 2019, when live, fresh, or chilled seafood accounted for ~70%, frozen products ~19%, dried, smoked, or salted items ~4%, and other preparations ~7%, suggesting a gradual shift toward fresher formats over time.
Channel Mix
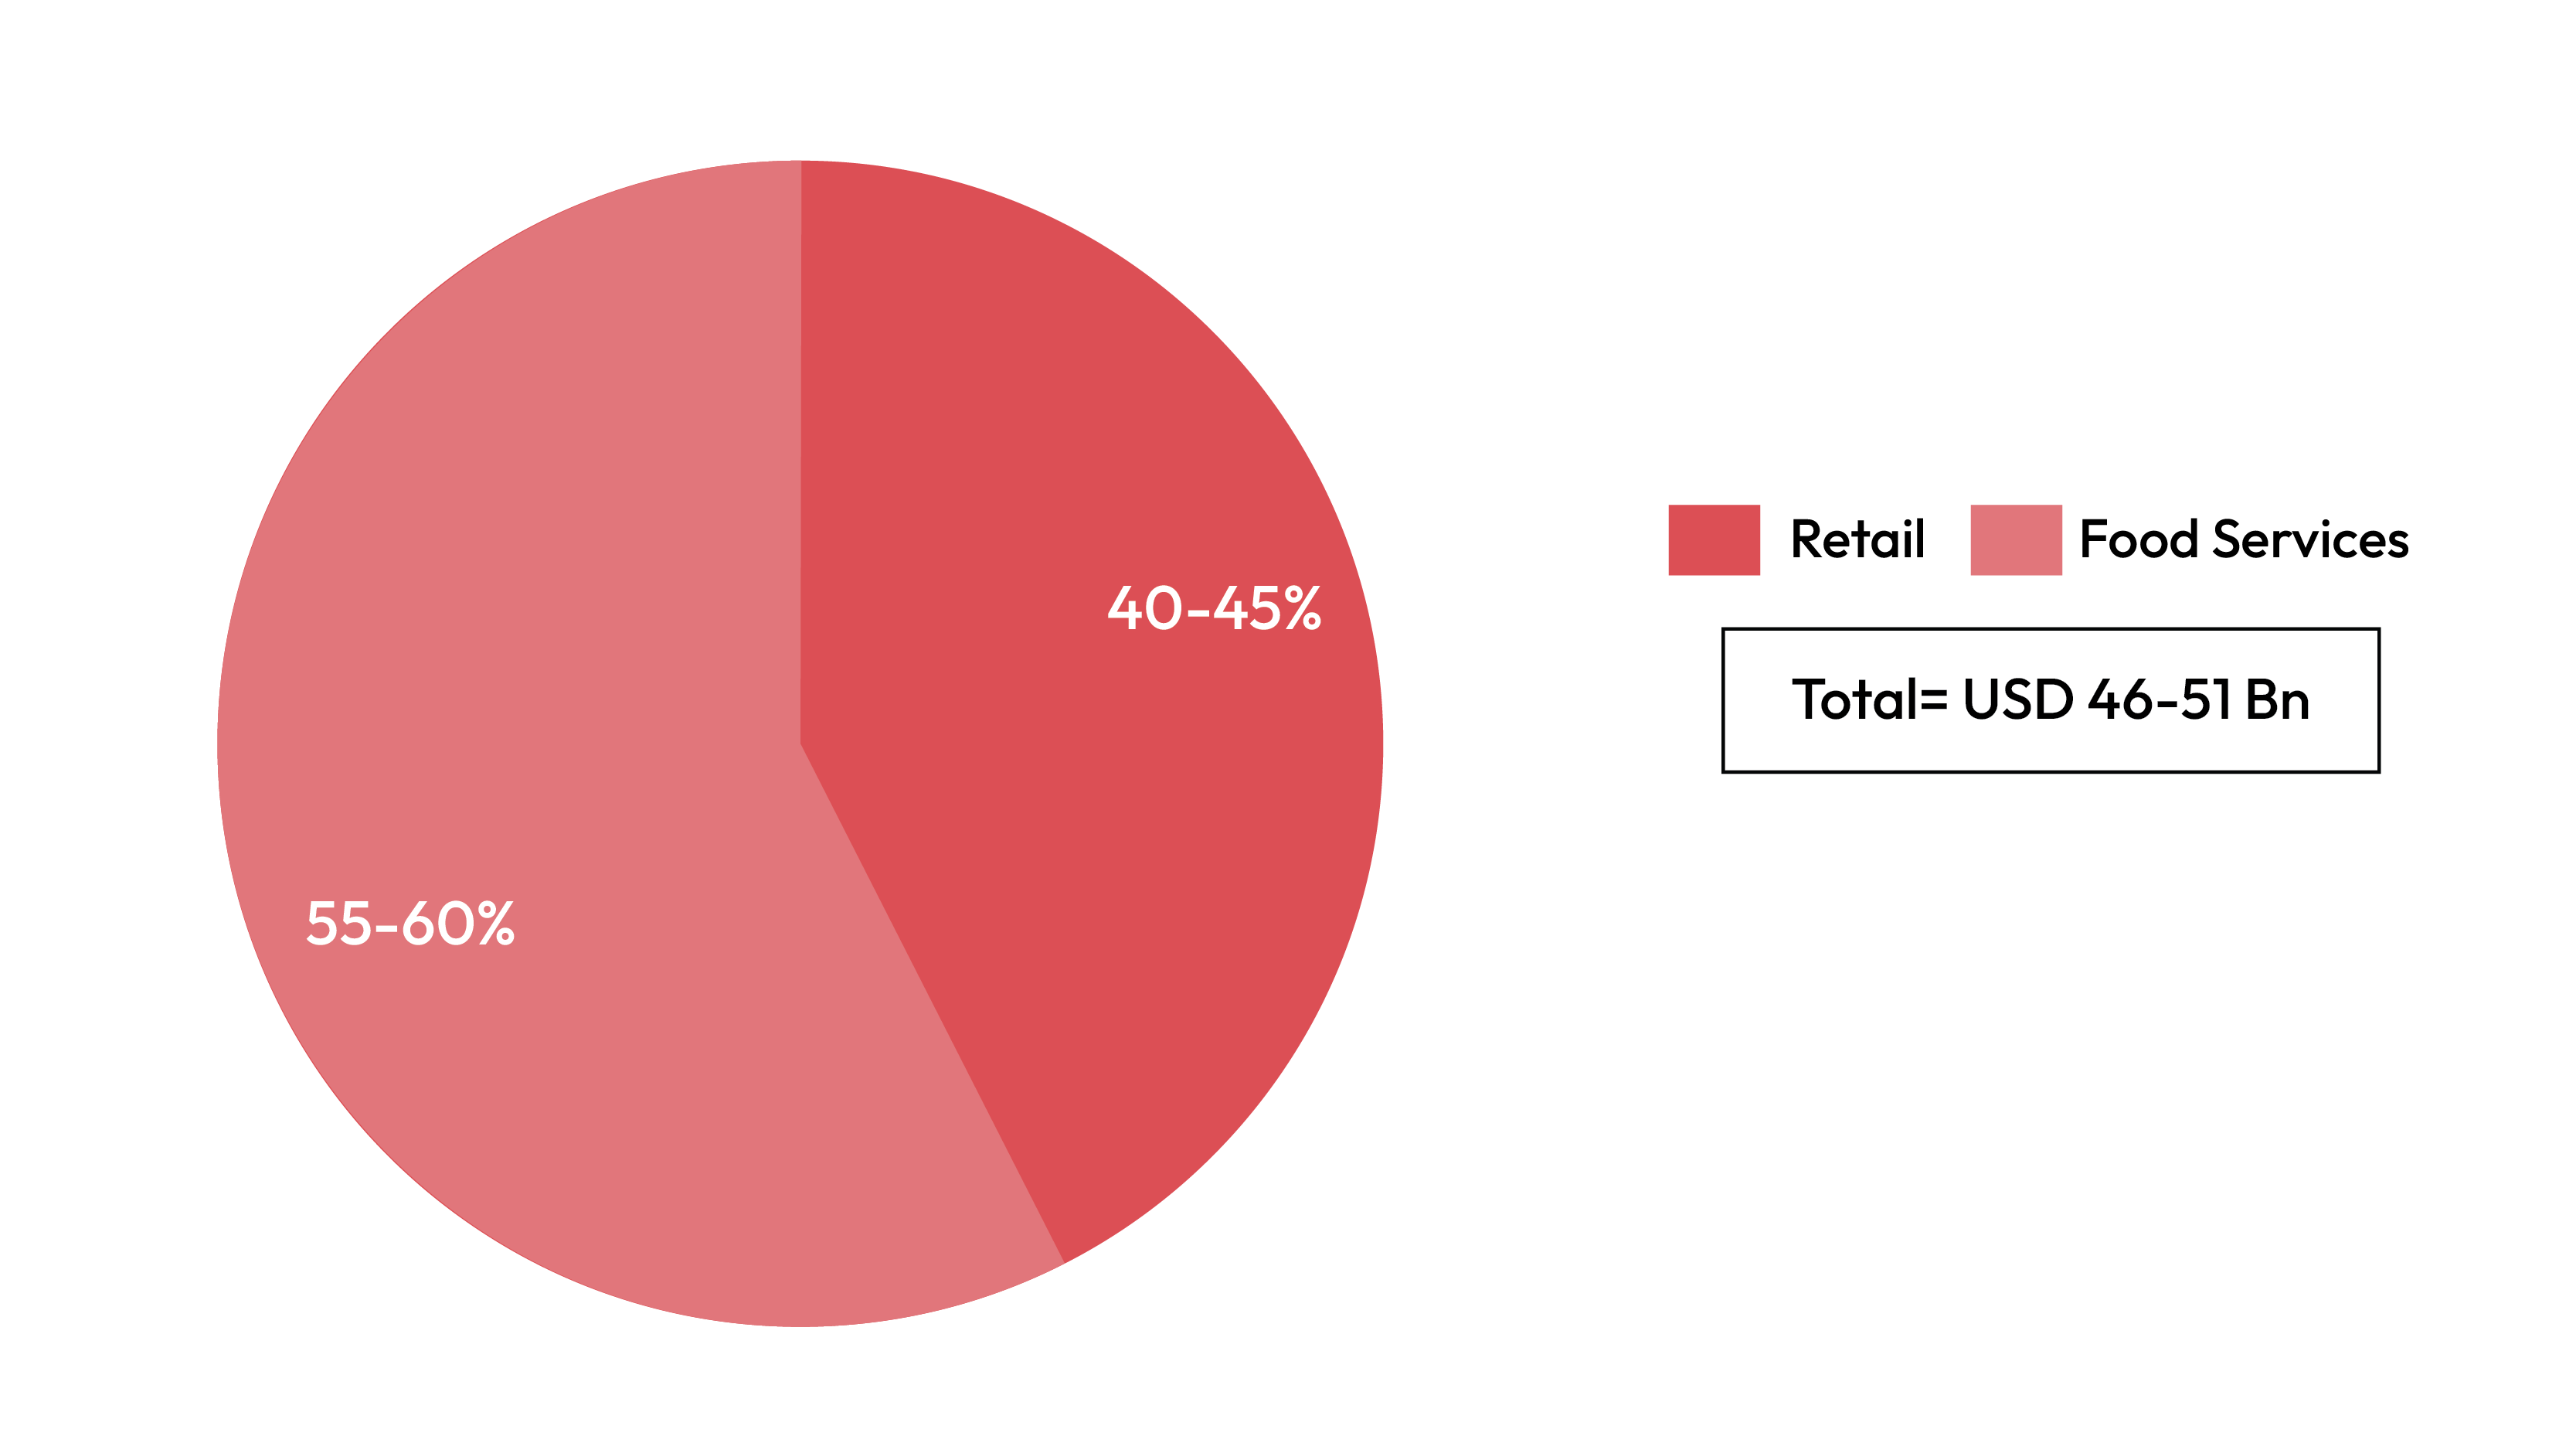
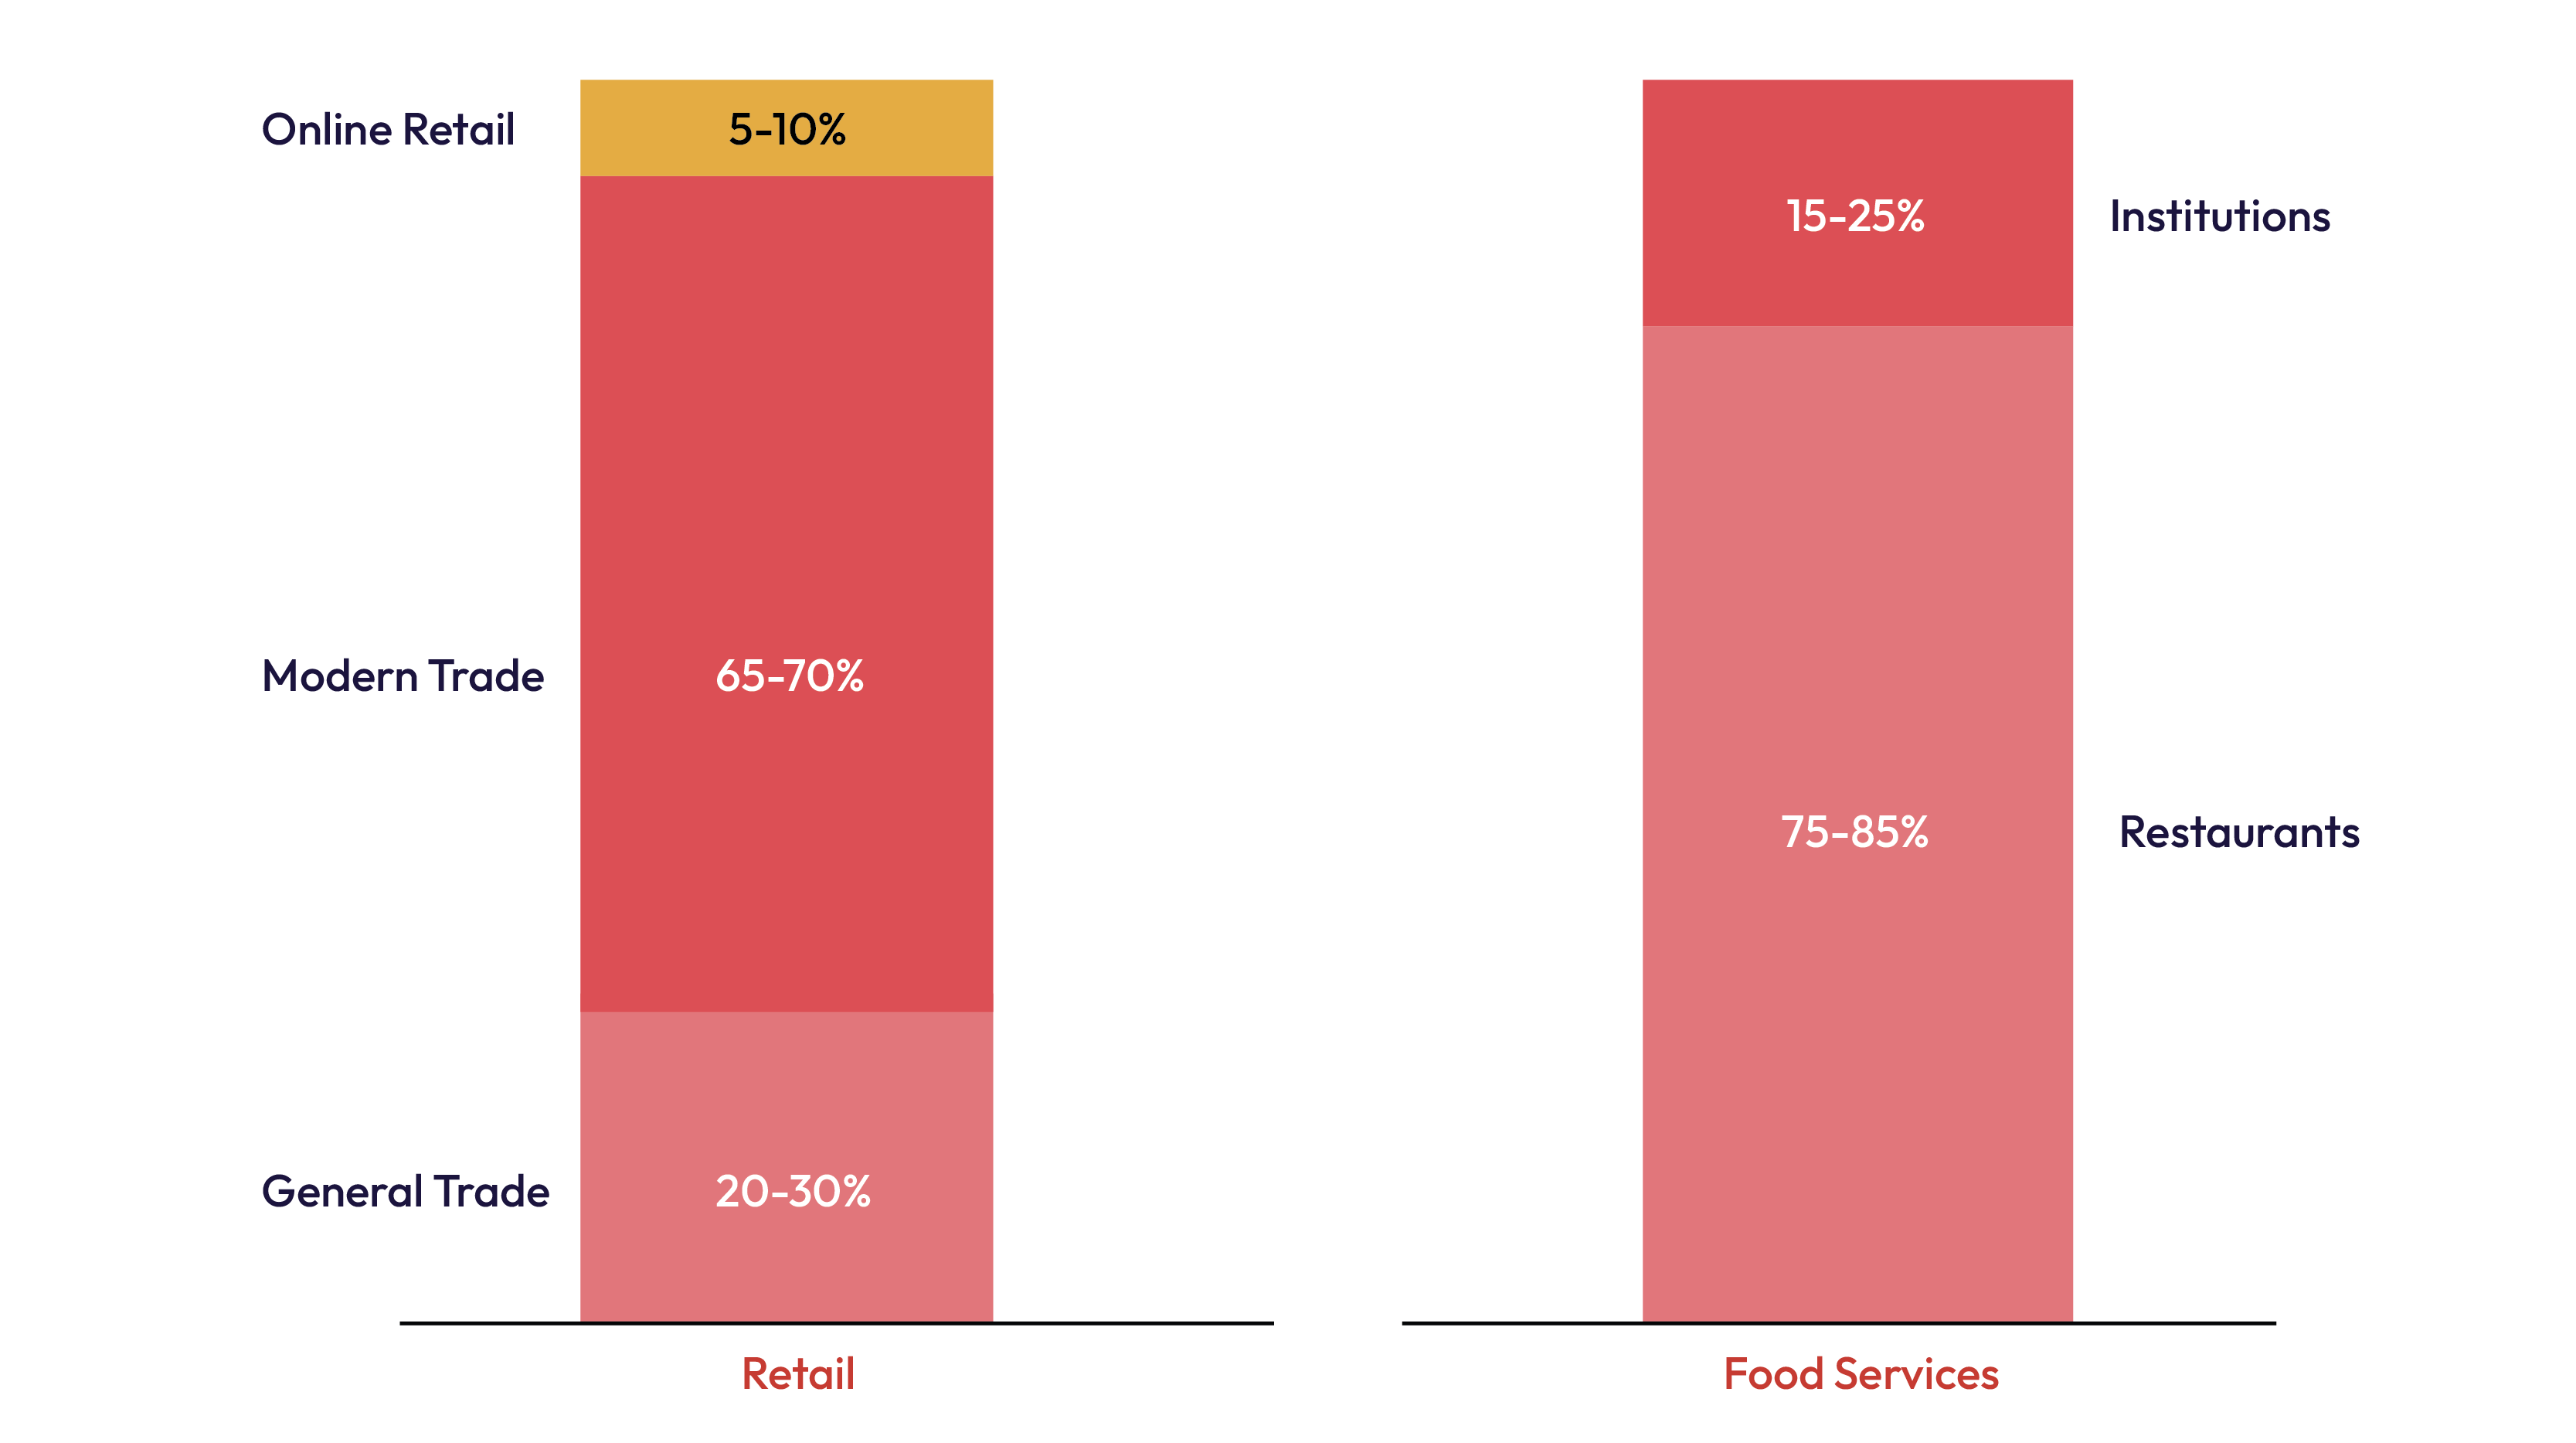
The US seafood market is dominated by the food services segment, contributing to 55-60% of the total market (in value terms). The retail segment, including grocery stores, supermarkets, and e-commerce platforms, accounts for 40-45% of the total market, while food service providers, including restaurants and cloud kitchens, make up the rest. Within the retail segment, modern trade channels (including supermarkets and hypermarkets) account for 65–70% of the market, while traditional independent outlets represent 20–30%, and online retail comprises 5–10%. In the food services segment, restaurants hold 75–85% of the market share, with institutional buyers constituting the remaining 15–25%. Key growth drivers in the U.S. include the continued expansion of retail footprint, comprising grocery stores, supermarkets, and an accelerating e-commerce segment, and higher adoption of ready-to-eat (RTE) and ready-to-cook (RTC) seafood products.
Changing Consumer Behaviour
Seafood consumption in the U.S. is influenced by regional preferences, evolving consumer habits, and a growing focus on convenience and sustainability. While the West Coast and Northeast have a well-established preference for fresh fish and shellfish, the Midwest and Southern states are witnessing increased demand for frozen and processed seafood due to expanding retail availability. Consumers are also exploring a wider variety of species, while inflation and rising food costs are contributing to a shift toward more affordable and longer-lasting seafood formats. As a result, retailers and foodservice providers are expanding offerings of responsibly sourced seafood, value-added products, and innovative seafood-based meal solutions.
Source(s): Redseer research and analysis